TeamPricingContact sales


As 2025 drew to a close, there was a growing belief that the commercial real estate market was finally starting to gain momentum. Inflation appeared to be moving in the right direction, investors expected additional Federal Reserve rate cuts, and many owners assumed lower borrowing costs would bring more buyers into the market. The optimism was understandable after several years of elevated rates, limited transaction activity, and a persistent gap in expectations between buyers and sellers.
Two months into 2026, military conflict with Iran sent shockwaves through global markets, replacing optimism with uncertainty overnight. Treasury yields moved higher, expectations for rate cuts were pushed further out, and the market increasingly accepted that interest rates could remain higher for longer.
DealGround used its proprietary data to analyze the retail transactions that closed between December 1, 2025 and May 31, 2026. We compared activity during the three months from December through February and compared it to the three months from March through May. Because properties sold in the different periods were not necessarily listed in the same period, this is not a perfect quarter-to-quarter comparison of listings and closings. It is intended to identify changes in the market across a large national dataset rather than establish a direct relationship between every property marketed and every property sold.
The results show a retail investment market that remained active but became considerably more selective. National transaction count declined 13.8%, while total aggregate dollar volume in the disclosure states fell 21.6%. The dollar-weighted discount from asking price to sale price increased from 5.2% to 13.5%. Median cap rates rose from 6.55% to 6.75% as buyers successfully negotiated lower purchase prices.
A 20 basis point increase in median cap rates may not, on its own, signal a market in meaningful pricing decline. In the context of today's market, however, it deserves further contemplation. Transaction volume has contracted to the point where the market is largely clearing only its best assets. If cap rates are moving higher under those conditions, the implications for everything below A-tier assets should not be underestimated. How cap rates behave over the remainder of 2026 may ultimately define this market. If cap rates continue to rise while only A-tier assets are consistently trading, downward pressure on pricing for B-quality and lower assets could accelerate.
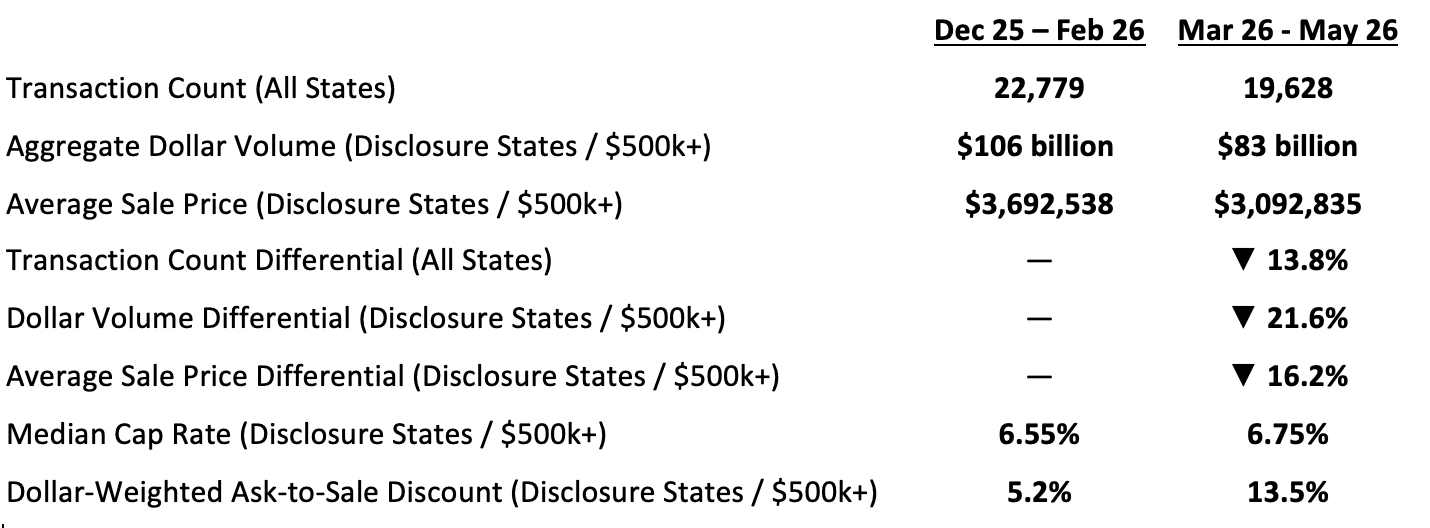
These figures do not indicate a market in collapse. They describe a market in which buyers were still willing to transact but had become less willing to compromise. Good properties continued to sell. Private capital remained active. Sellers who priced properties realistically were able to complete transactions. The greatest slowdown appeared in larger deals.
The commercial real estate industry began 2026 with more optimism than it had shown in several years. The Federal Reserve had already started lowering rates, inflation appeared to be moderating, and investors expected that additional cuts would improve financing conditions and increase transaction volume. Sellers who had resisted bringing properties to market began to believe pricing might strengthen. There was an expectation that the bid-to-ask gap would narrow.
Retail fundamentals remained relatively strong. Most retailers had become more disciplined about store openings, construction costs limited new supply, and well-located shopping centers continued to benefit from low vacancy and rising rents. The investment sales market was not waiting for retail operating performance to recover. In most cases, the properties were performing well. The problem was the cost of capital and its effect on what buyers could afford to pay.
The early part of the study period reflected some of that optimism, although December must be treated separately from a normal month. Year-end tax planning, 1031 exchange deadlines, institutional reporting requirements, and the desire to complete transactions before December 31 traditionally produce a surge in closings. It would be misleading to treat December activity as a normal monthly baseline.
Even after accounting for that seasonality, spring showed a more than ordinary decline following year-end closings. Transaction count fell and dollar volume declined faster than transaction count. At the same time, buyers began negotiating more aggressively on transactions that did move forward.
National retail transaction count declined 13.8% between the two periods. In the disclosure states, dollar volume declined 21.6%, showing that the decrease was not limited to the number of properties sold. The average size of completed transactions also moved lower.
That distinction matters. A 13.8% decline in transaction count is noticeable but not extraordinary, particularly when the first period includes December. The larger decline in dollar volume shows that the composition of the market changed. Smaller private-capital transactions continued to close, while a significant portion of the market for larger assets pulled back.
The market did not stop functioning. Buyers continued acquiring grocery-anchored centers, neighborhood retail, single-tenant properties, and assets with durable income. Financing remained available for strong properties with predictable cash flow. The difference was that buyers became much more disciplined about pricing and more willing to walk away when the numbers did not work.
For brokers, the change was obvious before it appeared in published reports. Broker follow-up became substantially more aggressive. I have joked with several people that if you dare look at someone’s deal, you should expect a barrage of emails and follow-up calls within five minutes. Any broker who has been in the business for a couple of cycles recognizes the behavior. Listing brokers do not chase buyers as aggressively when they already have multiple qualified offers.
That does not mean every listing was struggling. It means brokers could no longer assume that simply putting a decent property on the market would create competition. More effort was required to identify buyers, keep them engaged, answer underwriting questions, and push transactions toward an offer.
Median cap rates moved upward by 20 basis points from 6.55% to 6.75% between the two periods. Rising interest rates clearly contributed to this increase. Further upward pressure on cap rates is likely for the foreseeable future. The Federal Reserve has signaled that markets should not expect cuts to the federal funds rate for the remainder of 2026, and increases remain possible. This has brought much of the optimism that characterized the beginning of 2026 to a halt. Never underestimate the power of market sentiment.
The matched listing data provides a clearer view of the market dynamics. During the December 1, 2025 through February 28, 2026 period, the dollar-weighted discount between asking price and sale price was approximately 5.2%. From March 1, 2026 through May 30, 2026, it increased to 13.5%.
The widening discount needs to be interpreted carefully. It does not mean that the typical seller accepted a 13.5% reduction from list price. The median discount increased only from 4.7% to 5.1%, which means that most completed transactions continued to fall within a relatively normal negotiating range. A smaller number of larger transactions with substantial price reductions exacerbated the increase in list-to-sale price ratio.
That is an important distinction. The market did not reprice evenly. Most properties did not suddenly lose 10% or 15% of their value. Buyers demanded larger concessions on specific transactions where the asking price, financing assumptions, or property risk no longer aligned with the market.
Another key factor that will always impact list-to-sales price variation is overpricing. Brokers often “buy” listings by agreeing to take them to market at unreasonable prices. This behavior will impact the ratio and serve to widen the gap in the best of markets. I don’t see that changing anytime soon.
In more selective markets like we are experiencing now, lower-quality properties may simply fail to trade. The transactions that actually close are disproportionately composed of assets that buyers consider higher quality. That selection preference can make the median cap rate appear stronger than the overall market actually feels.
This is one reason brokers and active investors often sense a change before it appears in published market data. They are not only watching the transactions that close. They are watching buyer tour requests, offer volume, lender feedback, retrades, closing extensions, and listings that quietly disappear from the market.
The properties that continued to command strong pricing generally shared familiar characteristics: durable income, quality real estate fundamentals, creditworthy tenancy, and no obvious issues. Buyers remained willing to compete for certainty. They just became far more selective.
The data confirmed several changes that had already become apparent in daily brokerage activity.
Buyers were reviewing more deals but pursuing fewer. They were quicker to dismiss properties that did not clearly meet their requirements and less inclined to stretch simply because an asset was located in a desirable market. They asked more questions about renewal probability, store performance, tenant credit, lease language, and capital requirements.
Lenders remained active, but financing assumptions became less predictable. Lender LOI’s were fewer and took longer to gather. Transactions that had little room for error became vulnerable to minor changes in the debt markets.
Listing brokers responded by increasing outreach and follow-up. That behavior is not criticism. It is exactly what brokers are supposed to do when buyer demand falls off. The aggressive follow-up is simply one of the clearest signs that the balance of power shifted during the spring.
Sellers also began making practical decisions. Some reduced prices. Others provided credits, extended due diligence periods, or accepted structures they would have rejected several months earlier. A portion of the inventory was removed from the market, particularly when owners lacked a compelling reason to sell. The market remained active because buyers and sellers adjusted their expectations.
None of these findings change the underlying investment case for retail real estate.
The sector entered the current cycle with relatively limited new construction, strong tenant demand, and a landscape with far less recent speculative development than the apartment or industrial markets. Many retailers are expanding, but the cost of building new stores has increased substantially. That supports the case for purchasing existing properties in established trade areas.
That does not mean retail pricing is disconnected from interest rates. No commercial property type enjoys such insulation. It means buyers still have reasons to remain active even when capital becomes more expensive.
The first half of 2026 did not show capital fleeing retail. It showed increased buyer selectivity. Buyers hold the cards in this market.
For sellers, pricing and preparation matter more in this environment. An aggressive asking price can work in a seller’s favor when buyer demand is strong enough to create competition. In a selective market, aggressive pricing may prevent qualified buyers from engaging at all.
For buyers, the slowdown creates opportunities but not necessarily distress. There is a vast difference between a seller becoming more reasonable and a seller being forced to sell. Buyers expecting broad discounts across every property will certainly be sidelined. The better opportunity is to identify transactions where the owner’s motivation, financing status, and property characteristics create a genuine basis for negotiation.
For brokers, the market rewards precision. Sending every listing to every buyer is less effective when investors are narrowing their criteria. The brokers who understand exactly who owns, buys, and finances a particular type of property will be better positioned than those relying on a large distribution list and hoping someone responds.
This is not the market to throw spaghetti at the wall and see what sticks. The brokers who succeed will be deliberate, targeted, and know exactly why they are calling an owner.
Traditional transaction reports are built almost entirely from closed sales. Closings are an important dataset to be sure. The problem with focusing only on closed sales is that the data is a lagging indicator.
DealGround tracks properties when they come to market. We collect the offering memoranda, asking price changes, property information, and marketing history, then connect that information to completed sales. That allows us to study not only what sold, but what sellers originally expected and how the offering changed before closing.
It also allows us to identify trends while they are happening. A decline in new listings, an increase in price reductions, a widening gap between asking and sale prices, or a change in the type of properties being marketed can appear long before the same trend is visible in conventional sale data.
The purpose is not to declare a turning point every time one metric moves. Commercial real estate data is messy, seasonal, and heavily influenced by a relatively small number of large transactions. The DealGround data advantage comes from the ability to compare multiple indicators and determine market movement.
During the spring of 2026, things changed.
The retail investment market remained open, but the velocity slowed. Buyers became more selective, large transactions became less common, and sellers accepted greater discounts when a property did not fit the narrower definition of what the market wanted.
Markets rarely change all at once. They tighten, they become more selective, and they reward those who recognize the shift first. That is exactly what DealGround was built to do.
Discover how DealGround gives brokers, investors, and appraisers a competitive advantage. Schedule a demo or start your free trial today.